Linear Relationships – first differences
QUESTION
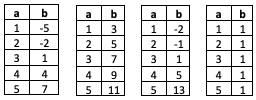 What does it mean to use “first differences” to determine which of the 4 tables shown at right represent non-linear relationships?
ANSWER
 To find first differences, look at column 2: subtract the 1st number from the 2nd, the 2nd from the 3rd, etc.
- If these differences are all the same, then you have a linear relationship.
- If not, then the relationship is non-linear.
Why?
- Well, linear relationships have graphs that are straight lines, so their slopes are constant.
- A linear relationship is like a typical staircase, where all steps are the same height.
- When you find first differences, it’s like finding the “height” of each of the steps.
We’re making some assumptions here about the numbers in column 1:
- they are in numerical order
- their first differences are all the same: for example, 1,2,3,4,5 or 1,3,5,7,9 would be fine, but 1,2,4,5,7 or 1,3,2,5,4 would not
BIGGER PICTURE
First differences (and second and third differences) help determine whether there is a pattern in a set of data, as well as the nature of the pattern.
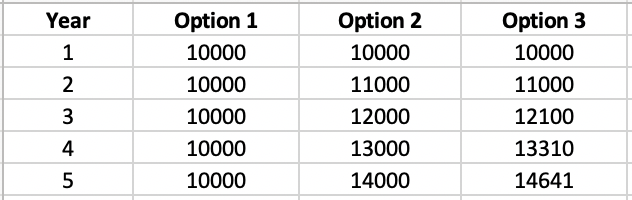
For example, let’s say you invest $1,000. Below are 3 growth options, tracked for 5 years. Which would you prefer?
Which option would you prefer?
Let’s look at how your investment grows in each option:
- In the first option, your investment grows each year by $0. (first difference is always 0)
- In the second option, your investment grows each year by $1000. (first difference is always 1,000)
- In the third option, your investment grows by $1,000 in the 1st year, $1,100 in the 2nd, $1,210 in the 3rd, and so on. The annual growth increases as the years pass. (first difference keeps changing/growing)
Options 1 and 2 have constant growth ($0 and $1,000 annually, respectively). Option 3 does not.
Data that has constant growth represent linear relations.
Linear relations, as the name suggests, have graphs whose points are in a straight line.
If you plotted the 3 options as a scatter plot (and extend for 20 years), it would look like this:
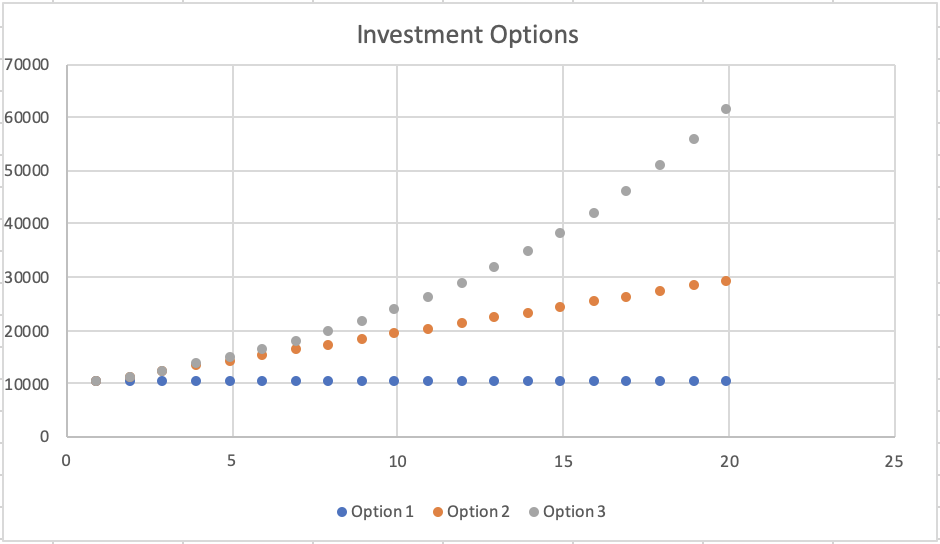
Surprised by this graph?
Why does the 3rd option so much better than the 2nd option, when at first it seemed so similar to the 2nd option?
- Option 1 gives you an additional $1,000 every year, which is constant growth.
- Option 2 gives you an additional 10% every year, which is exponential growth.
Here are the equations for the 3 options.
![]()
SECOND DIFFERENCES
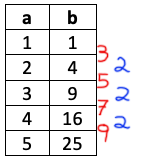
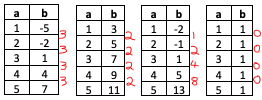
What about second differences? Let’s look at the table on the right.
- The first differences are in red.
- The second differences are in blue.
Here’s a context for this:
 column 1 could represent time
- column 2 could represent distance travelled by a falling object
- the first differences relate to the speed of the object (notice the speed keeps increasing, which makes sense for falling objects)
- the second differences would relate to the speed of the speed, or the acceleration of the object, like the acceleration due to gravity, which is constant.
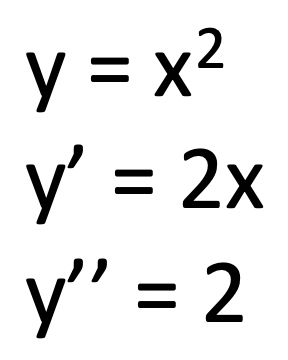 If you studied Calculus:
- the first differences relate to the first derivative (y’)
- the second differences relate to the second derivative (y”)
Linear and non-linear relationships across the grades
What are the first differences in the Grade 1 growing pattern shown below?

What linear relationship does the above pattern represent?
See http://learnx.ca/growing-patterns/ for more like this, such as:
- linear and other relationships across grades 1, 4 and 9
- an interview with applied mathematician Lindi Wahl, and
- a music video from Grades 1/2 classrooms, with lyrics based on parent comments
COMPUTATIONAL MODELLING
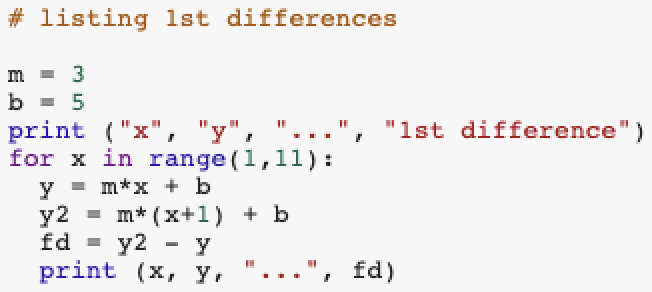
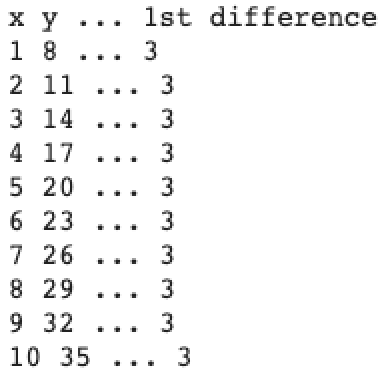
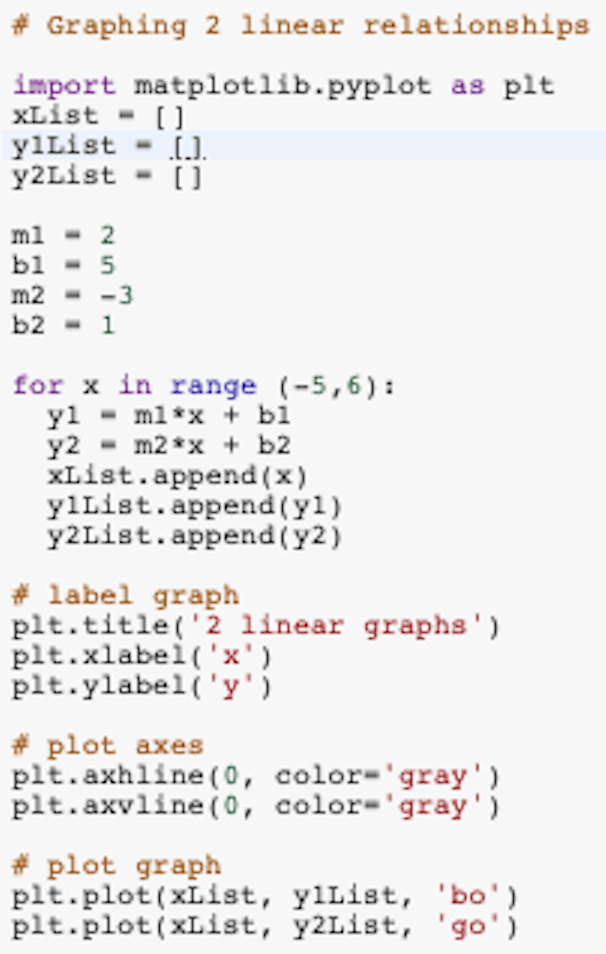
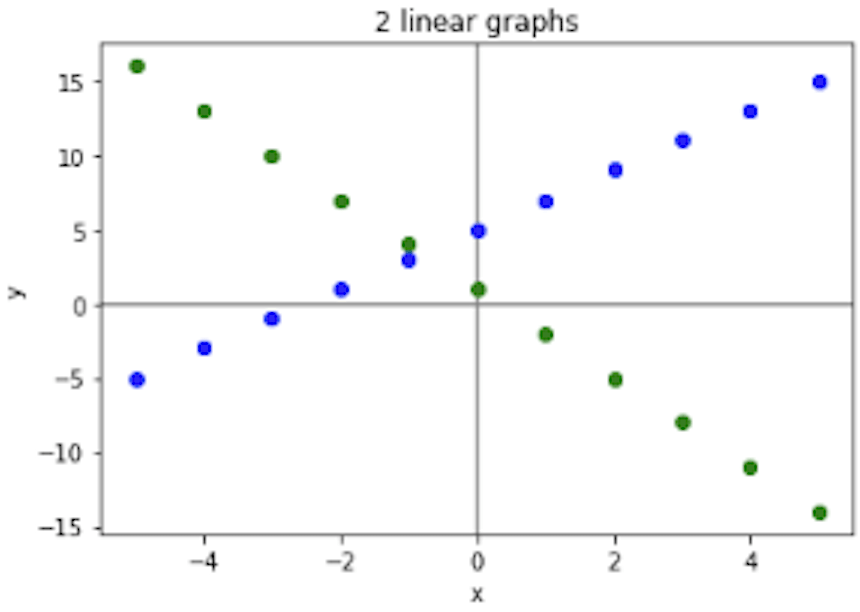
Click on the link below to use code to investigate first differences as well as graphs of linear relations.
Investigate first differences: